Податотека:Projected changes in crop yields at different latitudes with global warming.png
Изворна податотека (1.322 × 694 пиксели, големина: 16 КБ, MIME-тип: image/png)
| Ова е податотека од Ризницата на Викимедија и може да се користи на други проекти. Подолу е наведена содржината на нејзината описна страница.
|
Опис
| Опис |
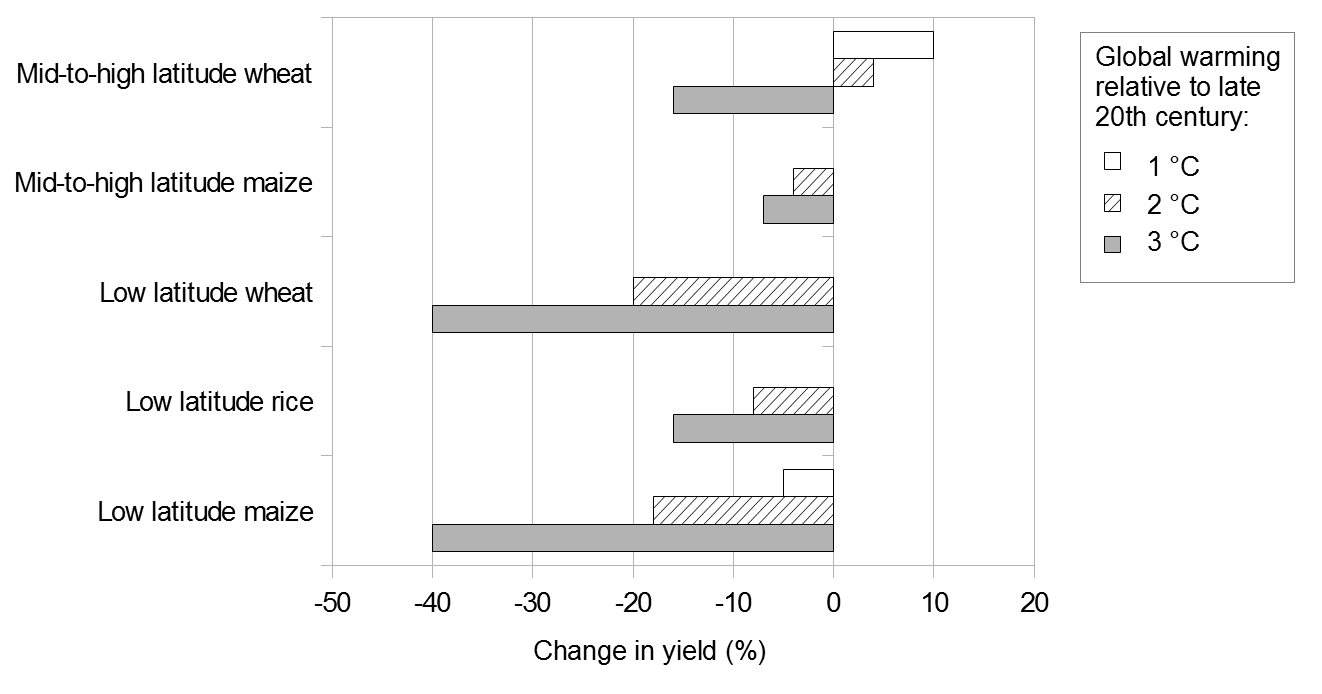
English: This bar graph shows projected changes in crop yields at different latitudes with global warming. Projected changes are shown for 1-3 °C of global warming, relative to late 20th century. For mid-to-high latitudes, changes in yield are shown for wheat and maize. For low-latitudes, changes are shown for wheat, rice and maize. In mid-to-high latitudes:
In low latitudes:
Data Values are approximate and are taken from the US National Research Council (US NRC, 2011).[1] The first, second and third numbers are the projected changes in yields (%) for 1, 2 and 3 °C of global warming, respectively.:
US NRC (2011)[1] drew on several studies. The graph does not show the "likely" ranges included in US NRC (2011).[1] The likely range means that there is a 67% chance of the projected change in yield being correct, based on expert judgement.[1] For 1 °C of global warming, the likely range is roughly equal to plus or minus (+/-) 10% for all projected changes in yields. Uncertainty increases with temperature. For 3 °C of warming, the likely range is roughly:
These projections broadly show the probable changes in regional yields.[2] The projections do not include measures to adapt to global warming.[2] Actual changes in yields may vary according to local conditions.[2] There are numerous other uncertainties, including how local climate will change with global warming, and the atmospheric concentration of carbon dioxide (CO2) associated with different magnitudes of global warming.[2] There is also the possibility that yields will change if critical thresholds are crossed.[2] Many of the uncertainties could bias the projections towards underestimating reductions in crop yields.[2] However, adaptation practices could help to reduce losses in yields.[2] Adaptation will be more difficult for higher magnitudes of warming, and may be less effective in tropical regions.[2] Notes
References
|
| Датум | |
| Извор | сопствено дело |
| Автор | Enescot |

|
Оваа слика (или сите слики од оваа страница/категорија) би требало бидат се преработи користејќи векторска графика со формат SVG. Тоа нуди неколку предности; видете „Податотеки за расчистување“ за повеќе информации. Доколку оваа слика веќе постои во SVG формат, тогаш подигнете ја. Откако ќе го направите тоа, заменете ја оваа предлошка со предлошката {{Vector version available|име на новата податотека.svg}}.
|
Comma-separated values
Data were exported from OpenOffice.org 3.4.1 Calc as comma-separated values (csv). The following options were used:
- Character set: Western Europe 1252
- Field delimiter: ,
- Text delimiter: "
- Quote all text cells: no
- Save cell content as shown: yes
- Fixed column width: no
,,,,,,
,,,,,,
,,,Global warming relative to late 20th century,,,
,,Region and crop,1,2,3,
,,Mid-to-high latitude wheat,10,4,-16,Changes in yield (%)
,,Mid-to-high latitude maize,0,-4,-7,
,,Low latitude wheat,0,-20,-40,
,,Low latitude rice,0,-8,-16,
,,Low latitude maize,-5,-18,-40,
Лиценцирање
| Оваа податотека е достапна под лиценцата Криејтив комонс Универзално предавање во јавна сопственост. | |
| Лицето поврзано со делото со овој документ го има предадено истото во јавна сопственост, откажувајќи се од сите права на тоа дело за цел свет, под законот за авторско право и поврзани или сродни законски права што ги имало на тоа дело, дотолку колку што е дозволено со закон. Делата под CC0 не бараат припишување (наведување автор и/или извор). Кога го наведувате делото, наводот не треба да подразбира каква било поддршка од авторот.
|
Историја на податотеката
Стиснете на датум/време за да ја видите податотеката како изгледала тогаш.
| Датум/време | Минијатура | Димензии | Корисник | Коментар | |
|---|---|---|---|---|---|
| тековна | 15:25, 21 јули 2013 | | 1.322 × 694 (16 КБ) | Enescot | {{Information |Description ={{en|1=This bar graph shows projected changes in crop yields at different latitudes with global warming. Projected changes are shown for 1-3&n... |
Употреба на податотеката
Податотекава се користи во следнава страница:
Глобална употреба на податотеката
Оваа податотека ја користат и следниве викија:
- Употреба на ar.wikipedia.org
- Употреба на bn.wikipedia.org
- Употреба на en.wikipedia.org
- Употреба на nl.wikipedia.org
- Употреба на zh.wikipedia.org